Showing posts with label anchor chart. Show all posts

Wednesday, August 14, 2013

Bar Graph, Line Graph, Line Plot, and Pictorial Graphs

During the week that we taught graphs, we chose to spend each day on a different type of graph.  Below are the lessons we used for each day. 

Monday
During the whole class lesson on Monday, students filled out their notebooks along with the anchor chart. Our focus on Monday was bar graphs but we filled out the complete anchor chart.

CCSS.Math.Content.3.MD.B.3 Draw a scaled picture graph and a scaled bar graph to represent a data set with several categories. Solve one- and two-step “how many more” and “how many less” problems using information presented in scaled bar graphs. For example, draw a bar graph in which each square in the bar graph might represent 5 pets.

Students were given an All About Me Quiz. Each day we focused on a different type of graph. We used the information from the quizzes to personalize the graphs for our classes on the anchor chart and for activities throughout the week. 
Tuesday
Our focus was on creating and interpreting line plots. Students used the SmartBoard at the teacher station to create line plots for different items on the All About Me Quiz. We then asked students different questions about the line plots and they answered on their white boards. At the independent station students played a game called Roll the Dice Line Plot. Students rolled a dice 20 times and recorded their results on a line plot. 

Smartboard notebook used to graph class data

Wednesday
The objective was pictorial graphs for Wednesday. Students created graphs on the SmartBoard and played Roll the Dice Pictorial Graph. 

Thursday
The goal for Thursday was line graphs. 

Friday
We reviewed all the different types of graphs by looking at the class graphs we created on the SmartBoard. The played Roll the Dice at the game station and reviewed bar graphs.  
Smartboard notebook used to graph class data


Students also completed an Explain Your Answer worksheet at the independent station.


Friday, August 9, 2013

Fractions: Common Core Edition

Hello, Friends!  Sorry for our long break from blogging, but we are glad to be back, and we plan to take the next few blogs to catch you up on how we ended the year.  

Shifting from State Standards to CCSS for Fractions
The fraction unit was a big shift with the adoption of CCSS from previous Missouri GLEs.  In the past, the first anchor chart pictured below was really all of the content that we were required to teach students over fractions.  Common Core requires more in-depth understanding of how fractions fit into the number line and compare to each other.  We split the requirements over three weeks and kept our anchor charts fairly similar for each week.  We obviously wanted the basic understanding of what a fraction is to be taught first.  Then we decided to teach equivalent fractions to make comparing fractions a little easier.  We really had to dig into the CCSS language to understand for ourselves what exactly was required for third graders to know.  

Week 1 Common Core Standards Taught:
  • CCSS.Math.Content.3.G.A.2 Partition shapes into parts with equal areas. Express the area of each part as a unit fraction of the whole. For example, partition a shape into 4 parts with equal area, and describe the area of each part as 1/4 of the area of the shape.
  • CCSS.Math.Content.3.NF.A.1 Understand a fraction 1/b as the quantity formed by 1 part when whole is partitioned into b equal parts; understand a fraction a/b as the quantity formed by a parts of size 1/b.
  • CCSS.Math.Content.3.NF.A.2 Understand a fraction as a number on the number line; represent fractions on a number line diagram.
    • CCSS.Math.Content.3.NF.A.2a Represent a fraction 1/b on a number line diagram by defining the interval from 0 to 1 as the whole and partitioning it into b equal parts. Recognize that each part has size 1/b and that the endpoint of the part based at 0 locates the number 1/b on the number line.
    • CCSS.Math.Content.3.NF.A.2b Represent a fraction a/b on a number line diagram by marking off a lengths 1/b from 0. Recognize that the resulting interval has size a/b and that its endpoint locates the number a/b on the number line.
Strategies Used:
Anchor Chart:

Week 2  Common Core Standards Taught:
  • CCSS.Math.Content.3.NF.A.3 Explain equivalence of fractions in special cases, and compare fractions by reasoning about their size.
    • CCSS.Math.Content.3.NF.A.3a Understand two fractions as equivalent (equal) if they are the same size, or the same point on a number line.
    • CCSS.Math.Content.3.NF.A.3b Recognize and generate simple equivalent fractions, e.g., 1/2 = 2/4, 4/6 = 2/3. Explain why the fractions are equivalent, e.g., by using a visual fraction model.
    • CCSS.Math.Content.3.NF.A.3c Express whole numbers as fractions, and recognize fractions that are equivalent to whole numbers. Examples: Express 3 in the form 3 = 3/1; recognize that 6/1 = 6; locate 4/4 and 1 at the same point of a number line diagram.
Week 2 Strategies Used:
Anchor Chart:

Week 3 Common Core State Standards Taught:

CCSS.Math.Content.3.NF.A.3d Compare two fractions with the same numerator or the same denominator by reasoning about their size. Recognize that comparisons are valid only when the two fractions refer to the same whole. Record the results of comparisons with the symbols >, =, or <, and justify the conclusions, e.g., by using a visual fraction model.

Week 3 Strategies Used:
Anchor Chart: 


Reflecting on the Unit

Fractions are such an abstract concept for kids to grasp, that spending at least three weeks teaching them is crucial for their understanding.  We look forward to teaching this concept again so that we can focus more on helping diverse learners understand the concept now that we know what they are expected to learn :).  One thing that we plan to change after having taught this unit is how this really helped students with measurement.  Our students struggled when we taught them measurement before fractions.  They had a difficult time understanding where 1/4 of an inch is located on a ruler.  This year, we plan to teach fractions before measurement.

--Tabitha & Chloé

Wednesday, December 5, 2012

Measurement

Anchor Charts: 


Student notebook entries:


 Today's Number:

This was a Pinterest find.  We adapted it to fit our third grade needs. :) Students work on Today's Number whenever they finish work at a station early.  They do this in the back of their math notebook.

When introducing Today's Number, we modeled how we wanted the students to write the answer to each Today's Number in their math notebook.  We thought it would be helpful to glue in a word form sheet so students could refer to it for #1. Spell it.  We also only introduced a few of the problems since we had not learned how to multiply and estimate. 


As students knew more skills, we turned over the rest of the problems.  Then we made the numbers larger.  Here is one student's work in her notebook.  This makes such an easy and beneficial sponge or anchor activity. 

Wednesday, October 10, 2012

Time, Money, +, -

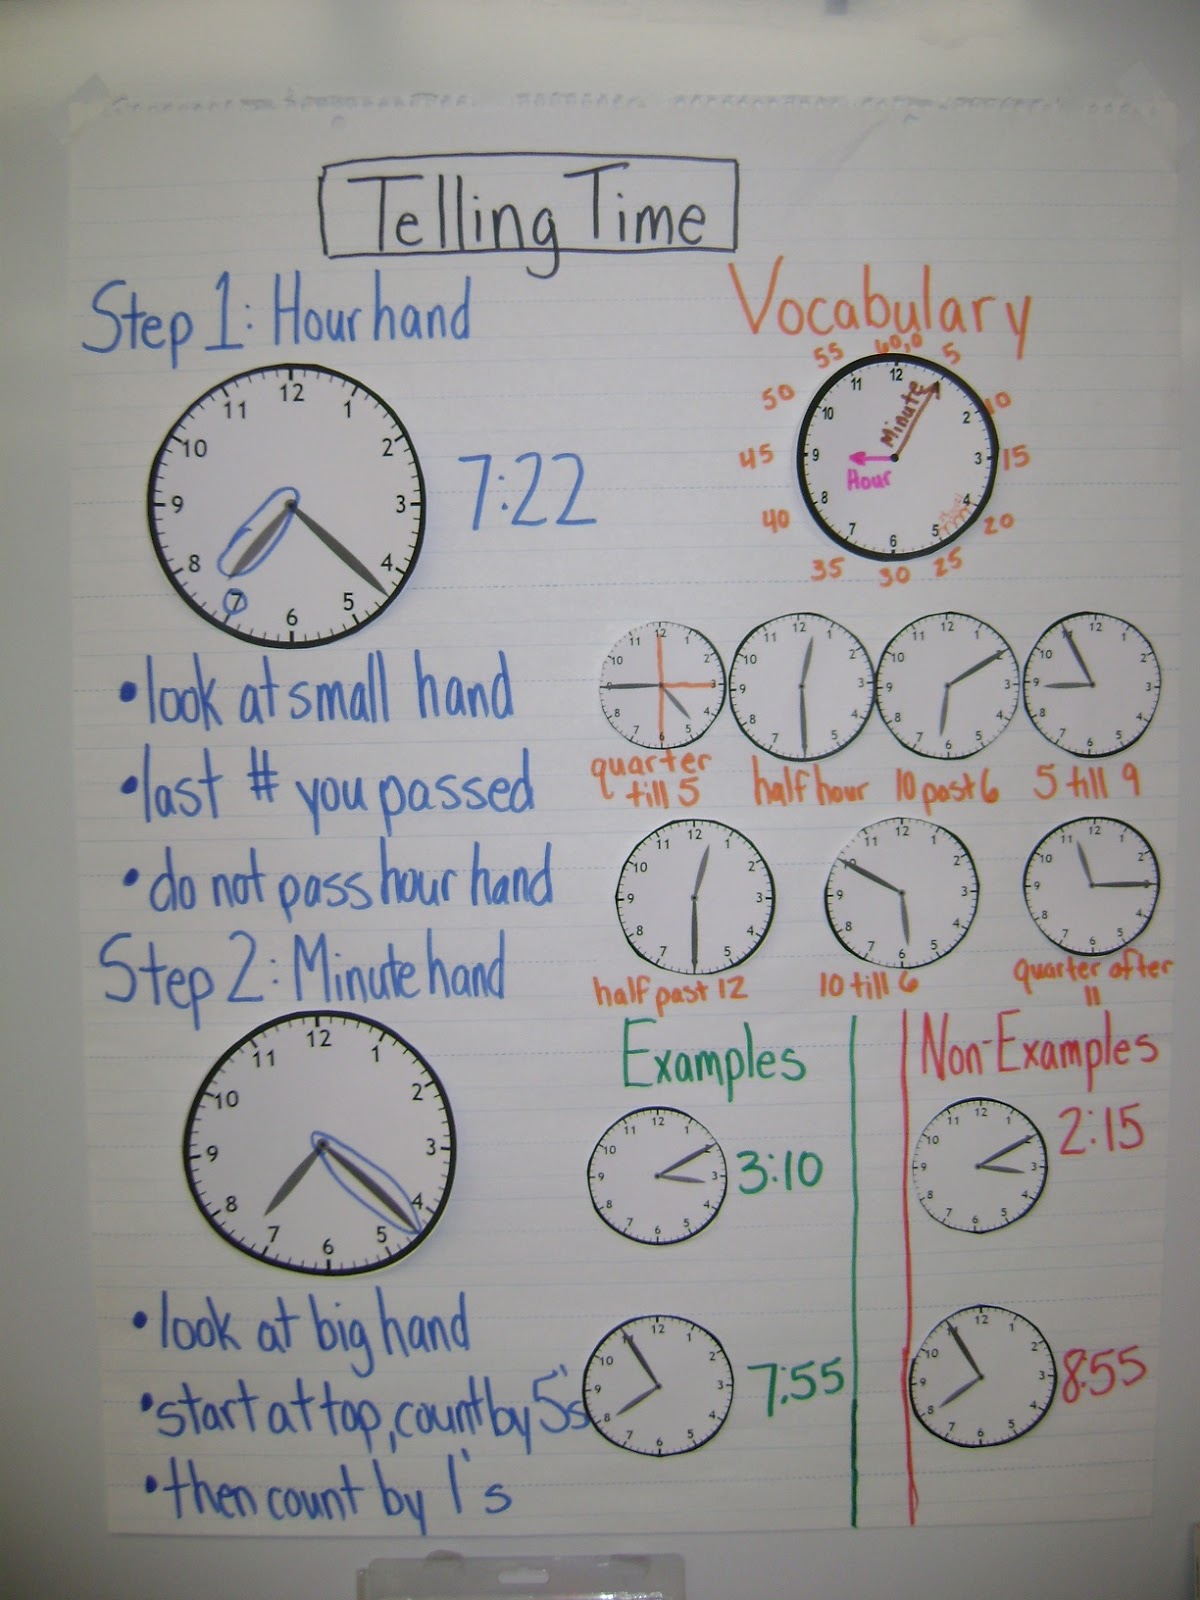
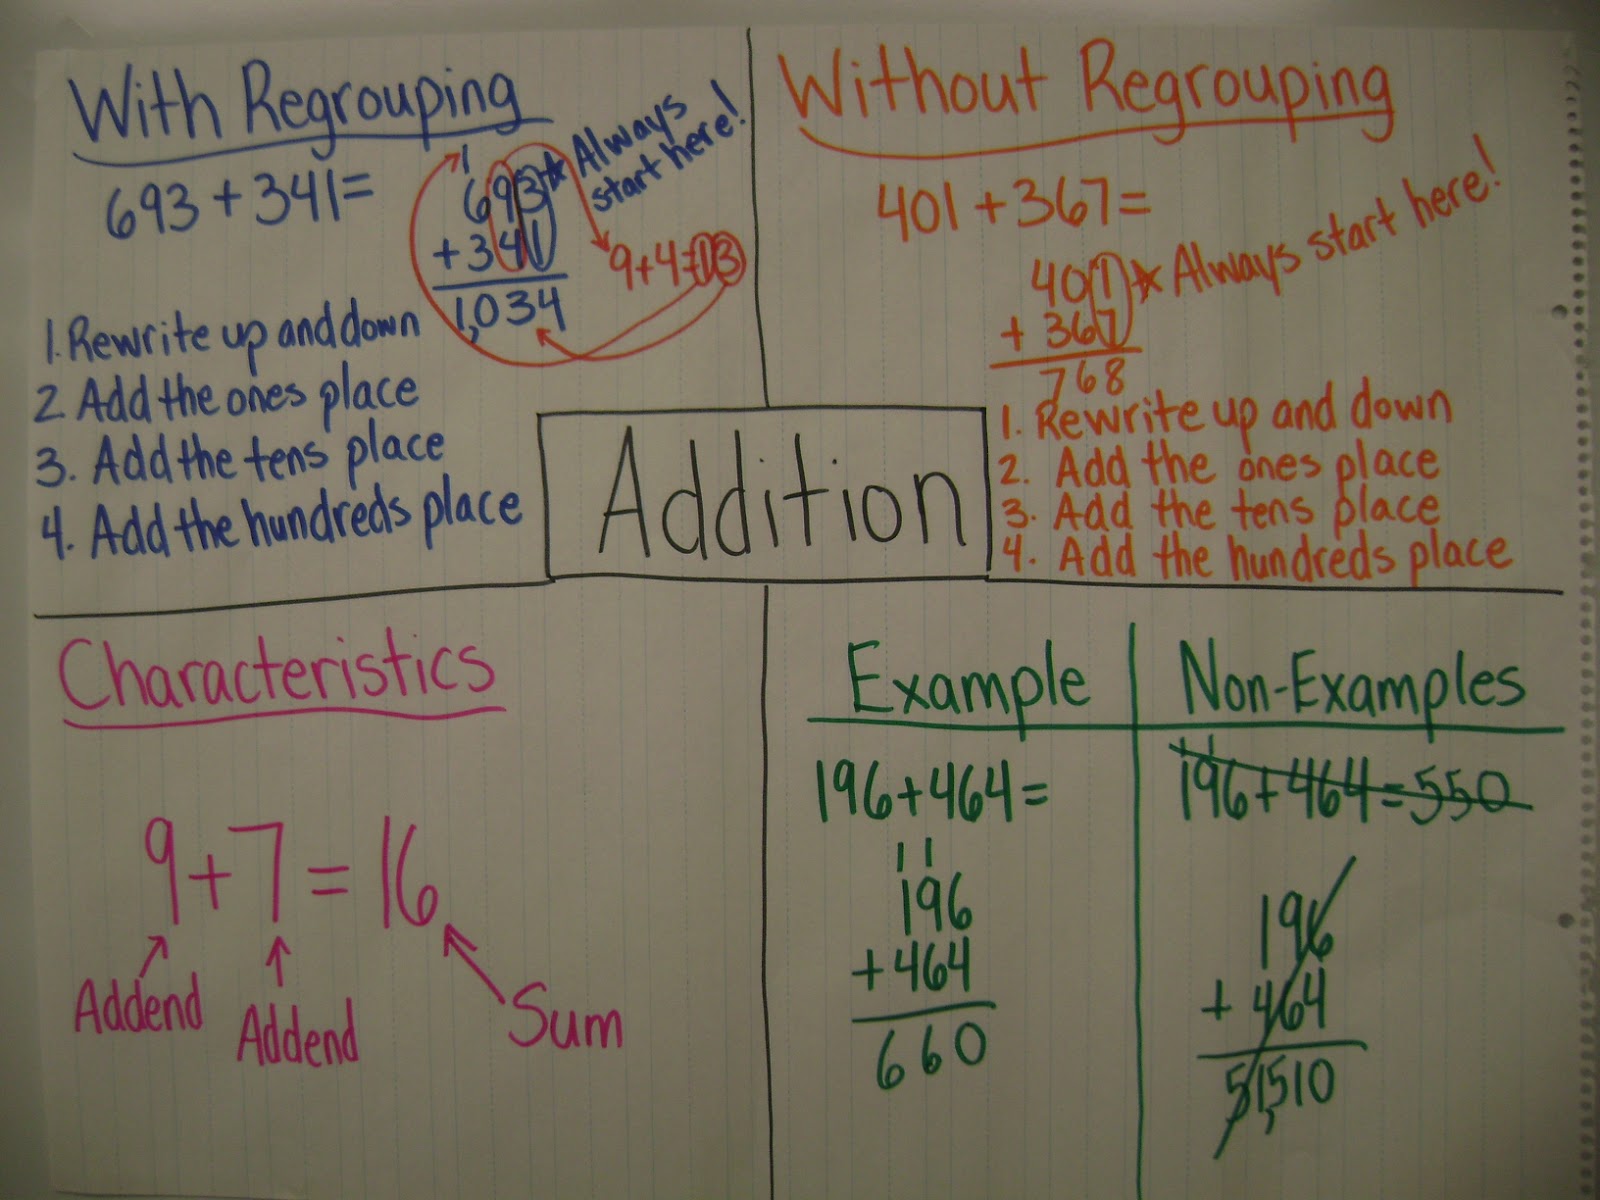
Here are a few anchor charts from the past few weeks:

We loved our time unit this week! One of the great resources provided by Everyday Math is the Game book.  This week we used three games: Match Time, Time Concentration, and Prize Time.  Prize Time involves assigning each student a time on their desk.  If they come to you at their assigned time, then they can get a prize.  What a cool way to motivate them to learn time! 

We loved teaching Change from $5.00 after subtraction this year.  It went so smoothly.  We saw huge growth at the end of the week, with 24/27 students scoring proficient on the exit slip!


Math Notebook Entries:

Each student has a math notebook that we add to on Mondays during whole-class instruction.  This is when we make our anchor charts (as seen above). Students copy down their version of the class anchor chart in their notebook.  We both like the organization that the Table of Contents provides. 
We created a blank template for the printable mini- Frayer Model charts for the weeks that the headings change.

But then some weeks it just takes less time for the students to write if we provide the headings...


Wednesday, September 12, 2012

Estimation, Math Notebooks, and Anchor Charts

This week we are teaching estimation by rounding to the nearest 10 and to the nearest 100, CCSS 3.NBT.1.  

On Monday, we created this anchor chart with our classes:

We also watched Brainpop!'s Rounding video and stopped before the Rounding Decimals part.

Students copied the anchor chart into their notebook onto their Frayer model anchor chart:

We also felt that it would help students to have a hundred chart with rounding tips, so they glued this chart from Super Teacher Worksheets into their notebook for this week, too.


Switching Groups Mid-Week

For the first time since starting math workshop, we changed our four math groups mid-week this week. We noticed certain students in the lowest group grasping estimation quicker than students in the low-medium group.  Based on yesterday's closure activity and in-class observations at the teacher station, we swapped some students between the red (lowest) and yellow (low-medium) groups.  For example, Johnny was in the red group but was catching on quicker than Suzy in the yellow group, so we switched the two.  Today, Suzy received more support during teacher station because her peers were at the same instructional level. This change emphasized to us how important ongoing assessment and closure are to driving instructional decisions. This is truly differentiated instruction.

Another Math Workshop Board


Anchor charts from the year so far...


Join us next week for a Q & A with a guest blogger, a fourth grade teacher starting math workshop this year! :) 

--Tabitha & Chloe